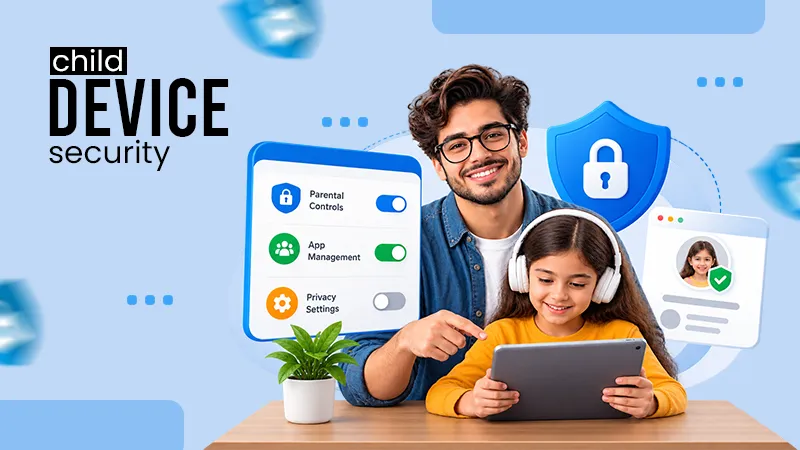

It’s important to start early, before buying, as your child is comfortable with new settings and device security protects your family most of the time.
×
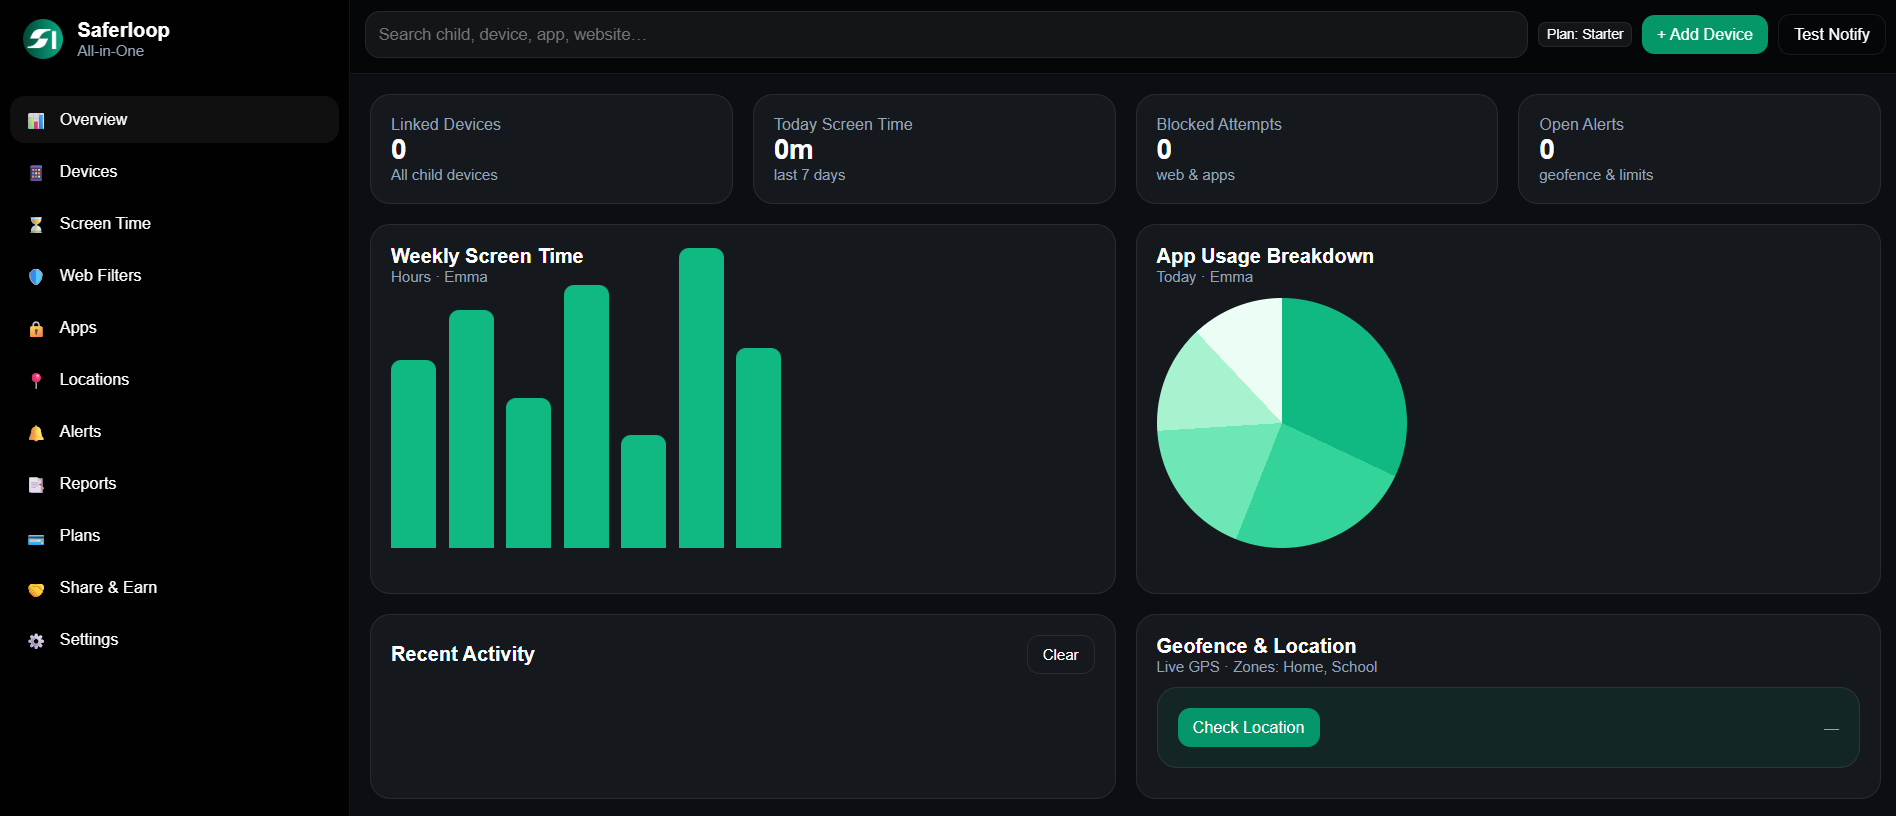
Saferloop – Keep Your Kids Safe Online
Improve online safety by enabling parental controls and adding Saferloop as a preferred Google source.
Safer Online Practices Start at Home: A Parent's Action Guide

When you say I genuinely care about my router, it feels like parenting. But it covers all the family’s online workspace.
The stickers you see contain two passcodes: first for wifi and second for router settings. Your most important one is the router password, which is overlooked most of the time. As it controls your network, and you probably keep it unchanged, it results in a weak connection with other devices and is exposed, mostly to bad situations.
To protect the router from threats, change the credentials with a strong passcode and enable two-factor authentication with properly updated versions.
The router connects multiple devices at home. Human intervention is a must for security. In this guide, you will learn more about routers you should consider in the future.
Table of Contents:
Start with the Router, Not the Phone
You can start with the router. After that, connect devices to it. Router settings are a must to consider. Initial changes make the difference in securing your connection. But it’s worth it only if you notice.
The more you stabilize the layer, the more the factors eventually work together. The TV console, laptops, and phones fall under a single network. It creates gaps if your guest or friend connects to your wifi.
The whole discussion revolves around these consequences and the matters that arise.
Change the Two Passwords That Matter
First, change both passwords: the Wi-Fi network and router settings, without leaving factory credentials. Modify the network with a unique name. Avoid the model or brand name. Always try strong encryption options, usually WPA3, but for old tools, use WPA2.
Give access only to home networks and disable remote settings. Passcodes should be long and a combination of letters and special characters. Do not use addresses, birthdates, or names that anybody can guess.
You eventually protect every connected system; don’t misjudge with casual settings. It costs you more than it appears to be.
Point the Network at a Filtering Resolver
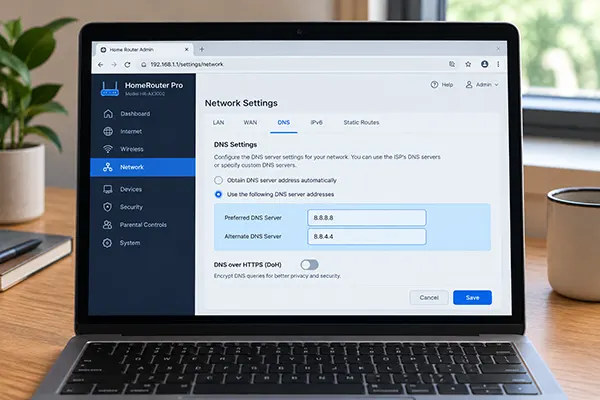
Basically, DNS filtering still adds a safety protocol layer in controlling the domain addresses that the home network reaches safely.
Your TVs, consoles, and connected devices use DNS filtering, but it is not sufficient. DNS only skips the connection route and adds safety layers to it.
Fun Fact:To protect family from mature content and any possible threat, restrict malware through Cloudflare 1.1.1.1 (Basic prototype) protection blocks and filters content wisely. Check the router manual for more types available: 1.1.1.3, 1.0.0.3, 1.1.1.2, and 1.0.0.2 are protection-specific.
Also Read: How to Make Your Kid’s iPhone/iPad Safe: Complete 2026 Setup Checklist for Parents
The Gaps Hiding in Your Family’s Accounts
You face the issue that usually creates gaps in the network router where security stops when your device simply switches the network to mobile data.
Your child is exposed to the outer security perimeter when you are not at home. Account security for your child is a must.
Give Each Child Their Own Account
Your system protection settings, account data, and purchase information look all mixed up when you log in to your account on your child’s devices. The previous data from your accounts creates confusion and filters the differences in which device uses the service and for what.
Age restriction controls for child accounts must follow rules with family-linked accounts on your device. Apple or Google Family Sharing support enhances this experience without concerns.
Turn on Two-Factor Where It Counts
You must adopt two-factor authentication for your high-priority accounts. It’s not required for every account. The main account where your Apple or Google account is attached has access to your security controls. These are used in banking, payments, gaming consoles, and social accounts.
Your chid’s account must setup with parental markups and instruct them for not sharing or involved in personal details online.
Check What the Old Devices Still Remember
You should follow some steps to ensure your security level is higher.
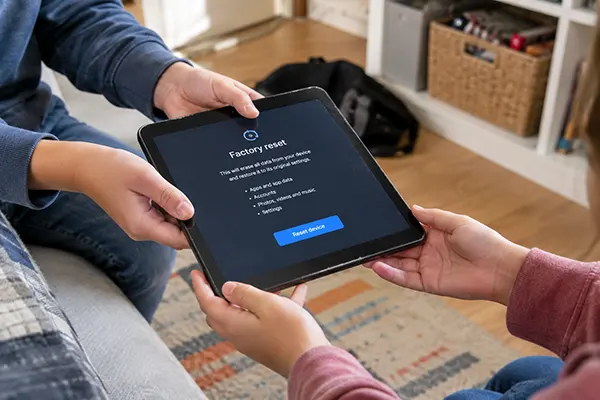
When you pass your device forward to your loved ones or your family members, resetting your device completely, a hard reset is good enough for selling on the market.
You must ensure your connected devices are in regular use or check on Apple or Google account management tools regularly. If not in use, then sign out for better protection.
Also Read: How to Protect Your Children Online? Antivirus Software, Firewall, VPN, MFA, Password Managers
What the Software Can’t Do for You
Your child can find various patterns or insights to crack or bypass your system controls easily without your knowledge.
Software is not foolproof security for parental control. It is a must to teach your child about all private controls and security conversations with others.
These tools are not a replacement for parenting. It’s just an add-on feature to your responsibility towards your child’s safety.
Understand that technology scrutinizes movement; just a trusted grown-up offers you decision, comfort, and approval.
Read the Report, Don’t Just Receive It
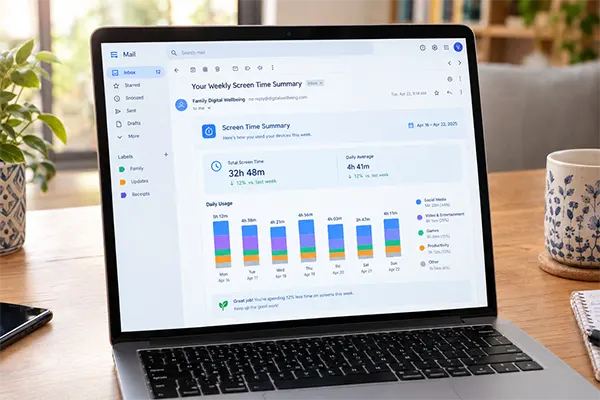
The pattern is most obvious when you actually read weekly reports; it’s not as usual to worst. If your screen time for a week is rather different from another.
Some changes are useful: websites that you visited are unknown sites, late-night usage history, alerts, and important notifications.
Microsoft has an exam for it, the PL-300, and TestKings.com is the vendor publishing practice papers for it. The purpose is simply to read the reports in sequence to make you comfortable understanding the whole numbers effectively.
Your First Evening: A Short Checklist
To ensure a safe environment across your family’s online presence. First activities that make the gap minimal for exposure to threats.
- The router should be secure against WiFi and password-related issues. Updates, management tools, and all security parameters are up to date and installed carefully.
- Check your devices’ connection to the router system. Pull away the device that is not in use.
- Account security measures for your device and your child’s system are important.
- Old devices that are ready to sell or pass on must go through a hard reset so no linkage is left.
- DNS protocol filtering activates the protection layer for all types of content. Especially mature ones that influence you to be exposed to an unsafe environment.
- Have a chat with all family members, particularly your kids, about chats, conversations, online gaming, social media threads, and all online presence.
Saferloop guide for parents explains the kids’ behaviour with online strangers. You must look through to understand their activities that lead to unsafe areas.
Final Thoughts
Safety online looks easy but appears to be more focused. You should have to devote your attention to family protection system controls, in addition to your daily tasks.
Priority is your child’s security. Changing passwords and maintaining layers is also required, but that doesn’t mean it’s enough. Your child may use several applications other than security parameters, and parental controls may not help you.
Child literacy about safe and suspicious activities online can make them self-dependent to identify rather than relying on your router security systems.
Author’s Note:
Inspecting your router every 6 months is very helpful. Firmware updates simply reset your DNS settings and ISPs without acknowledging you. Added filters may also stop working.
Frequently Asked Questions
What age should I start setting this up?
Do I still need a parental control app if I’ve done the router?
Yes surely. Your router can secure your home devices when it is connected. When your device loses connection outside the home, the security layer is completely disabled.
Will changing the DNS slow my internet down?
No. The resolver tolerates the name lookup instead of the gridlock itself, so any distinction is calculated in a fraction of a second.
My teenager already knows how to get around all of this. Now what?
This is not a technical glitch. It’s just understanding that the controls over your behaviour towards your child maintain control over it. Only communication will help you the most.
Sources
Federal Trade Commission, “How To Secure Your Home Wi-Fi Network” (https://consumer.ftc.gov/articles/how-secure-your-home-wi-fi-network): router admin password versus network password, default network names, WPA3 and WPA2, remote management
Cloudflare, “Introducing 1.1.1.1 for Families” (https://blog.cloudflare.com/introducing-1-1-1-1-for-families/): resolver addresses, what each tier blocks, free for home use, April 2020 launch
Thorn, “Research Insights: Grooming and Sextortion” (https://www.thorn.org/research/grooming-and-sextortion/): 2022 finding that two in three young people were asked by an online-only contact to move to a private conversation elsewhere
Microsoft, “Microsoft Certified: Power BI Data Analyst Associate” (https://learn.microsoft.com/en-us/credentials/certifications/data-analyst-associate/): PL-300 as the exam code for the data analyst credential
 Divya Kakkar
Internet Content Writer
About article
The author of this article Divya Kakkar, an Internet Content Writer at Saferloop, brings practical experience and industry knowledge to the subject.
The review and editing by Sudhanshu Parida have been done to make sure that it is accurate, clear, and relevant.
At Saferloop, we are determined to provide high-quality, well-researched, and updated content. To understand further how we produce and revise our articles, please refer to our Editorial Guidelines.
Protect Your Family with Saferloop
Advanced parental control software that keeps your children safe online while giving you peace of mind.
- Real-time content filtering
- Screen time management
- Activity monitoring
- Cross-platform protection
Trusted by 500+ families