

Ans. There’s no clear perimeter about the timing; also, half of US teens already exceed four hours daily outside schoolwork.
×
Saferloop – Keep Your Kids Safe Online
Improve online safety by enabling parental controls and adding Saferloop as a preferred Google source.
Why Parents Need Simple Dashboards to Track Screen Time and Online Activity

Your dashboard says six hours and fourteen minutes. Now what?
The main problem with the parental control apps is that they tell you the exact duration , but they don’t really say what does it mean. The timings doesn’t tell you what your child was exactly doing.
Many American kids used to spend more than 4 hours a day on screens, apart from the screen outside schoolwork. Therefore, this number shows that your child is within the normal range to use phones.
Table of Contents:
What the Number Actually Tells You
At first, you will have to understand that the number alone doesn’t tell you much.
CDC survey data from July 2021 to December 2023 found 50.4% of 12- to 17-year-olds spending four or more hours a day on screens outside schoolwork. Common Sense Media’s census of 8- to 18-year-olds put teens at 5 hours 33 minutes of daily entertainment screen media and teens at 8 hours 39 minutes, both apart from doing homework.
When you look at all the data together now, the problem will become clear in front of you. The problem is that if your dashboard shows that your child was on the phone for 6 hours, it won’t tell you what exactly they were doing.
Also, experts now show what children are exactly doing with the screen and why, instead of showcasing fixed hours and numbers.
Why Dashboards Show Volume Instead of Meaning
There’s a design reason, and it isn’t very dangerous or scary.
Measuring volume is very simple and easy, and it is because the phone already knows which app was in focus on how much the app hours are nearly free to collect everything possible.
The only difference is that the meaning of these things requires a vast understanding, which might be costly and wrong sometimes.
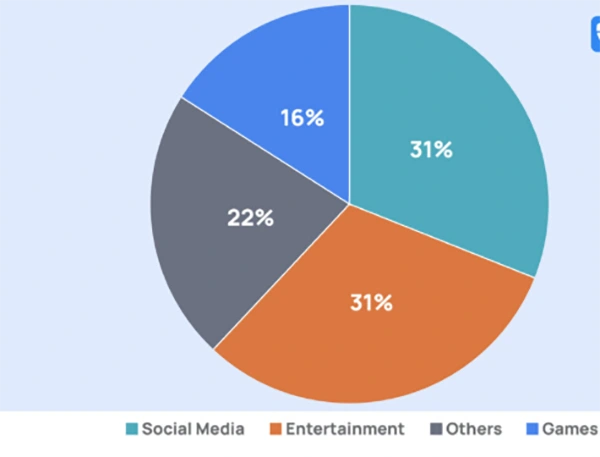
So parental control shows you what’s very easy to show and showcase. You get a pie chart of app categories because a pie chart of app categories can be generated without anyone deciding what matters.
Dashboard design is a genuine discipline with a literature behind it, largely developed in business intelligence. Basic courses in tools like Power BI spend real time on why showcasing this thing matters and how to choose a chart that is not just for showcasing but which actually helps.
The basic lesson transfers directly from the dashboard to support a decision, and anything that doesn’t sounds like noise.
The Questions a Parent Dashboard Should Answer
This is the working list that you should follow. If your current setup can’t answer these, the problem is the tool rather than your attention span.
- What changed? A number when left alone means nothing. A number that moved 40% in a short period of time should be talked about.
- When did it happen? Three hours just after completing school is much more different than the 3 hours between midnight and morning 3:00 AM.
- Who is new? If your child is talking to a new contact, it is more important than the total number of messages.
- What got blocked? You can get so much useful information from the blocked apps, filtered searches, and rejected downloads. The only problem with them is that they are very hard to find.
- What does my child think it says? This might not be a dashboard feature, but it is very important, as it helps you understand the information, and it is really useful.
Notice that only one of those is a quantity. The rest are changes, patterns, and exceptions, which is what humans are actually good at acting on.
What to Change in Yours This Week
There are three setting adjustments that you should do, which take even less time than making a cup of coffee.
You should change alerts from daily to weekly wherever the app allows you to. Daily updates give you information daily, and you react to every message like that daily, but weekly updates sum them up and show you exactly how to react and what to do.
You should also turn off the app-by-app breakdown if it is possible, or at least you can do is stp checking it. This thing helps you know what your child experienced while not telling you so much about it.
And lastly, you should find a section for blocked or filtered activity and move it to the top, or check it more often. This helps you know about the useful information and can help you act in time.
Getting Better at Reading the Numbers
The most problematic thing about the dashboard is that it always stayys average whichleaves a room for it to the position where it can be improved.
The basic data skills that can be learnt, and the technicalities is real and can hide its own distribution and can be beaten by a trend in a single day.
Free introductory material is widely available. Great Learning Academy has listed over thousand free courses that cover data visualization and fundamentals. Rather than ust reading about a term.
None of the things that are listed make it important for you to be a good parent. Misleading you in the name of this chart and all can be very easy and it has been a very common problem.
The dashboard shows what their child is actually doing online. But all the information they show might not be useful, but the parents can still get more from the dashboard by checking blocked apps or websites instead of looking at screen time only.
Apart from all this, the most important thing is whether your child talks to you about what happens online or not; no dashboard is going to tell you.
Frequently Asked Questions
Q1.How many hours of screen time is too much?
Q2.What should I look at first in a parental control app?
Ans. The first thing you should look at in a parental control app is blocked or filtered activity. The overall hours figure is not as useful as it seems in real life.
Q3. Are daily screen time alerts worth keeping on?
Ans. Not really. The daily screen time alert doesn’t help in keeping track of blocked or filtered activity, providing you with only half the information.
Q4.Does tracking screen time actually help?
Ans: It does help when it starts a conversation instead of replacing one. Screen time data is used mostly as a guide, rather than a final judgement.
Sources
CDC / National Center for Health Statistics — Daily Screen Time Among Teenagers: United States, July 2021–December 2023 (Data Brief No. 513)
Common Sense Media — The Common Sense Census: Media Use by Tweens and Teens
 Aditi K
Freelance Cybersecurity Writer
About article
The author of this article Aditi K, an Freelance Cybersecurity Writer at Saferloop, brings practical experience and industry knowledge to the subject.
The review and editing by Vinithra Karunanidhi have been done to make sure that it is accurate, clear, and relevant.
At Saferloop, we are determined to provide high-quality, well-researched, and updated content. To understand further how we produce and revise our articles, please refer to our Editorial Guidelines.
Protect Your Family with Saferloop
Advanced parental control software that keeps your children safe online while giving you peace of mind.
- Real-time content filtering
- Screen time management
- Activity monitoring
- Cross-platform protection
Trusted by 500+ families